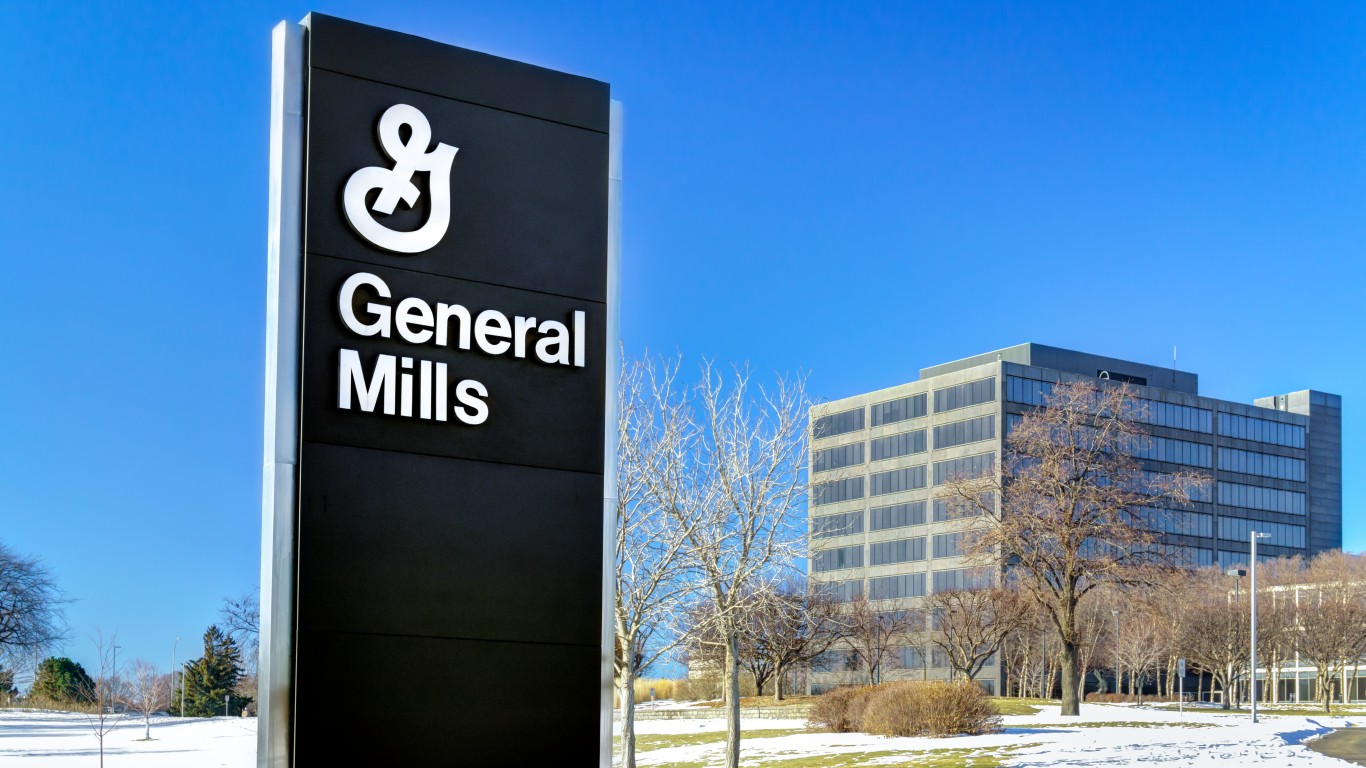
General Mills (GIS) Stock
General Mills (GIS) closed at $35.24 on Nov 16, 2026; its Tenet Score is 27 of 100 against 99 Consumer Defensive peers.
7 figures withheld by our checks. Each blank figure names its reason.
Key stats
- Previous close
- $35.24
- Nov 16, 2026
- Market cap
- $18.4B
- share price × the latest quarter's diluted weighted-average share count (vendor)
- Dividend yield
- 7.11%
- past year's regular dividends ÷ price
- 52-week range
- 31.18 – 49.59
- low → high · as of close, Nov 13, 2026
- Tenet Score
- 27/100
- Weak · 99 Consumer Defensive peers
Industry: Food & Beverage
General Mills, Inc. scores 27/100. Weak. Financial health is the soft spot versus 99 Consumer Defensive peers.
Tenet Score · vs sector
n=99Factor grades
Price
The whole report, at a glance · every card is a live peek, click any to open the section
- ✕ Buffett Quality
- ✕ Piotroski F-Score
- ✕ Munger Compounders
- ✕ Graham Defensive
- ✕ Income & Dividend Safety
- ✕ Dividend Growth
Pays 7.11%. Yield is one component of total return.
13F flows & insider trades land here.
General Mills, Inc. manufactures and markets branded consumer foods worldwide. The company operates in five segments: North America Retail; Convenience Stores & Foodservice; Europe & Australia; Asia & Latin America; and Pet. It offers ready-to-eat cereals,…
Similar-sized companies in Food & Beverage
The 10 companies in this industry closest in market cap, as of Nov 13, 2026.
| Company | Tenet Score | Market cap |
|---|---|---|
| Hershey CompanyHSY | 58 | $35.0B |
| Archer Daniels Midland Co.ADM | 36 | $34.7B |
| Kraft Heinz CoKHC | 47 | $29.7B |
| Constellation Brands IncSTZ | 51 | $24.6B |
| Tyson Foods, Inc.TSN | 37 | $20.7B |
| Coca-Cola Consolidated IncCOKE | 55 | $14.3B |
| Brown-Forman Corp.BF.A | 57 | $14.2B |
| McCormick & Co., Inc.MKC | 49 | $12.6B |
| Hormel Foods Corp.HRL | 44 | $12.2B |
| Celsius Holdings IncCELH | 61 | $8.1B |
Compare General Mills with
Common questions
What sector and industry is General Mills in?
General Mills is in the Consumer Defensive sector and the Food & Beverage industry.
What is General Mills' Tenet Score?
General Mills' Tenet Score is 27 out of 100, ranked against 99 Consumer Defensive peers as of Nov 13, 2026.